Group Financial Highlights (FY2025)
Financial Highlights
| FINANCIAL YEAR ENDED 31 DECEMBER | ||||||||||||
|---|---|---|---|---|---|---|---|---|---|---|---|---|
| 2025 | 2024 | 2023 | 2022 | 2021 | ||||||||
| INCOME (RM’000) | ||||||||||||
| i. | Revenue | 5,107,149 | 5,630,715 | 6,086,118 | 7,110,496 | 6,012,754 | ||||||
| ii. | Profit before tax and interest | 983,257 | 1,223,648 | 1,257,835 | 1,455,367 | 1,610,004 | ||||||
| iii. | Profit before tax | 855,390 | 1,105,166 | 1,101,919 | 1,330,460 | 1,449,898 | ||||||
| iv. | Profit attributable to owners of the Company | 500,323 | 650,480 | 800,325 | 950,655 | 900,433 | ||||||
| FINANCIAL POSITION (RM’000) | ||||||||||||
| Assets | ||||||||||||
| i. | Total assets | 18,672,817 | 19,035,525 | 18,650,634 | 18,654,245 | 17,481,224 | ||||||
| ii. | Net assets | 7,937,427 | 7,978,975 | 7,876,447 | 7,673,661 | 7,507,391 | ||||||
| iii. | Current assets | 6,210,015 | 6,932,407 | 6,789,775 | 6,895,636 | 7,524,553 | ||||||
| Liabilities | ||||||||||||
| i. | Current liabilities | 3,851,391 | 4,171,760 | 4,403,175 | 4,250,747 | 3,943,221 | ||||||
| ii. | Borrowings | 6,933,369 | 7,156,792 | 6,834,261 | 7,069,000 | 6,316,317 | ||||||
| iii. | Net borrowings* | 3,796,858 | 3,507,028 | 3,413,329 | 4,213,074 | 3,222,631 | ||||||
| Equity | ||||||||||||
| i. | Paid-up share capital | 3,519,554 | 3,519,554 | 3,519,554 | 3,519,554 | 3,519,554 | ||||||
| ii. | Shareholders' equity | 7,937,427 | 7,978,975 | 7,876,447 | 7,673,661 | 7,507,391 | ||||||
| iii. | Total equity | 9,385,143/td> | 9,420,211 | 9,274,734 | 8,994,223 | 8,704,759 | ||||||
| iv. | Total equity (excluding intangible assets) | 9,324,951 | 9,356,847 | 9,207,486 | 8,956,389 | 8,666,823 | ||||||
| Number of shares | ||||||||||||
| - Weighted average share in issue net of treasury shares ('000) | 2,489,670 | 2,489,670 | 2,489,670 | 2,489,670 | 2,489,670 | |||||||
| - Shares in issue net of treasury shares ('000) | 2,489,670 | 2,489,670 | 2,489,670 | 2,489,670 | 2,489,670 | |||||||
| SHARE INFORMATION | ||||||||||||
| Per Share | ||||||||||||
| i. | Basic earnings (sen) # | 20.10 | 26.13 | 32.15 | 38.18 | 36.17 | ||||||
| ii. | Net assets (RM)@ | 3.19 | 3.20 | 3.16 | 3.08 | 3.02 | ||||||
| iii. | Dividend (sen) | 20.00 | 20.00 | 25.00 | 30.00 | 35.00 | ||||||
| iv. | Share price | |||||||||||
| - Year High (RM) | 3.58 | 4.93 | 7.40 | 8.30 | 8.85 | |||||||
| - Year Low (RM) | 2.40 | 3.37 | 3.03 | 5.75 | 7.30 | |||||||
| - as at 31 December (RM) | 2.84 | 3.50 | 4.55 | 6.40 | 7.70 | |||||||
| v. | Market capitalisation (RM’000) | 7,070,662 | 8,713,844 | 11,327,997 | 15,933,885 | 19,170,459 | ||||||
| vi. | Trading volume (’000) | 150,802 | 89,297 | 498,221 | 119,715 | 93,248 | ||||||
| FINANCIAL RATIOS | ||||||||||||
| i. | Return on total assets (%) | 2.68 | 3.42 | 4.29 | 5.10 | 5.15 | ||||||
| ii. | Return on shareholders’ equity (%) | 6.30 | 8.15 | 10.16 | 12.39 | 11.99 | ||||||
| iii. | Current ratio (times) | 1.61 | 1.66 | 1.54 | 1.62 | 1.91 | ||||||
| iv. | Net Debt-to-Equity ratio (times) ^ | 0.41 | 0.37 | 0.37 | 0.47 | 0.37 | ||||||
| * | Net borrowings comprised borrowings net of money market deposits and cash and bank balances |
| ** | Net of treasury shares |
| @ | Net debt-to-equity ratio is computed based on net borrowings and total equity (excluding intangible assets) |
| # | Based on weighted average number of shares in issue net of treasury sharess |
| ## | Based on number of shares in issue net of treasury shares |
Dividend per Share

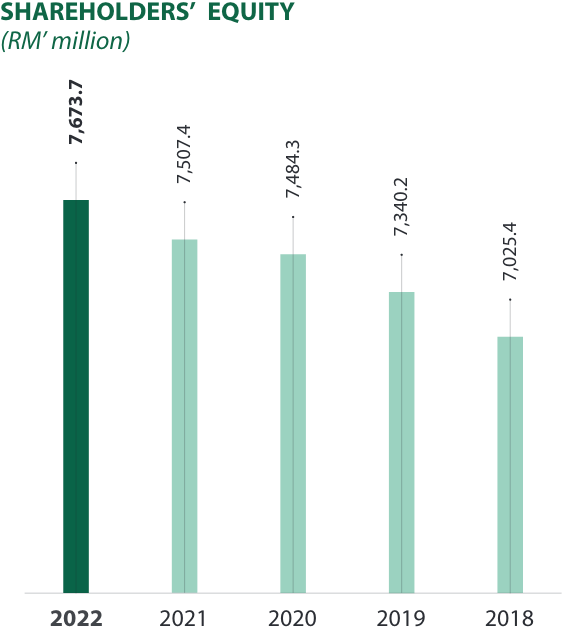
Shareholders’ Equity
Current Ratio

Net Debt-To-Equity Ratio

Revenue

Profit Before Tax

Total Assets / Net Assets

Basic Earnings per Share / Net Assets per Share
